

COVID’S IMPACT
So what has been the impact of COVID on southern California’s high school runners?
To answer that question we collected and analyzed 53,799 performances from the Woodbridge Invitational for the five years 2019 through 2021.
And if there were any notions that COVID hasn’t impacted athletes in our local school running programs we’re going to dispel that here and now.
The Numbers are In . . .
Cutting to the chase, the chart below highlights the key metrics we culled from the 53,799 Woodbridge performances.
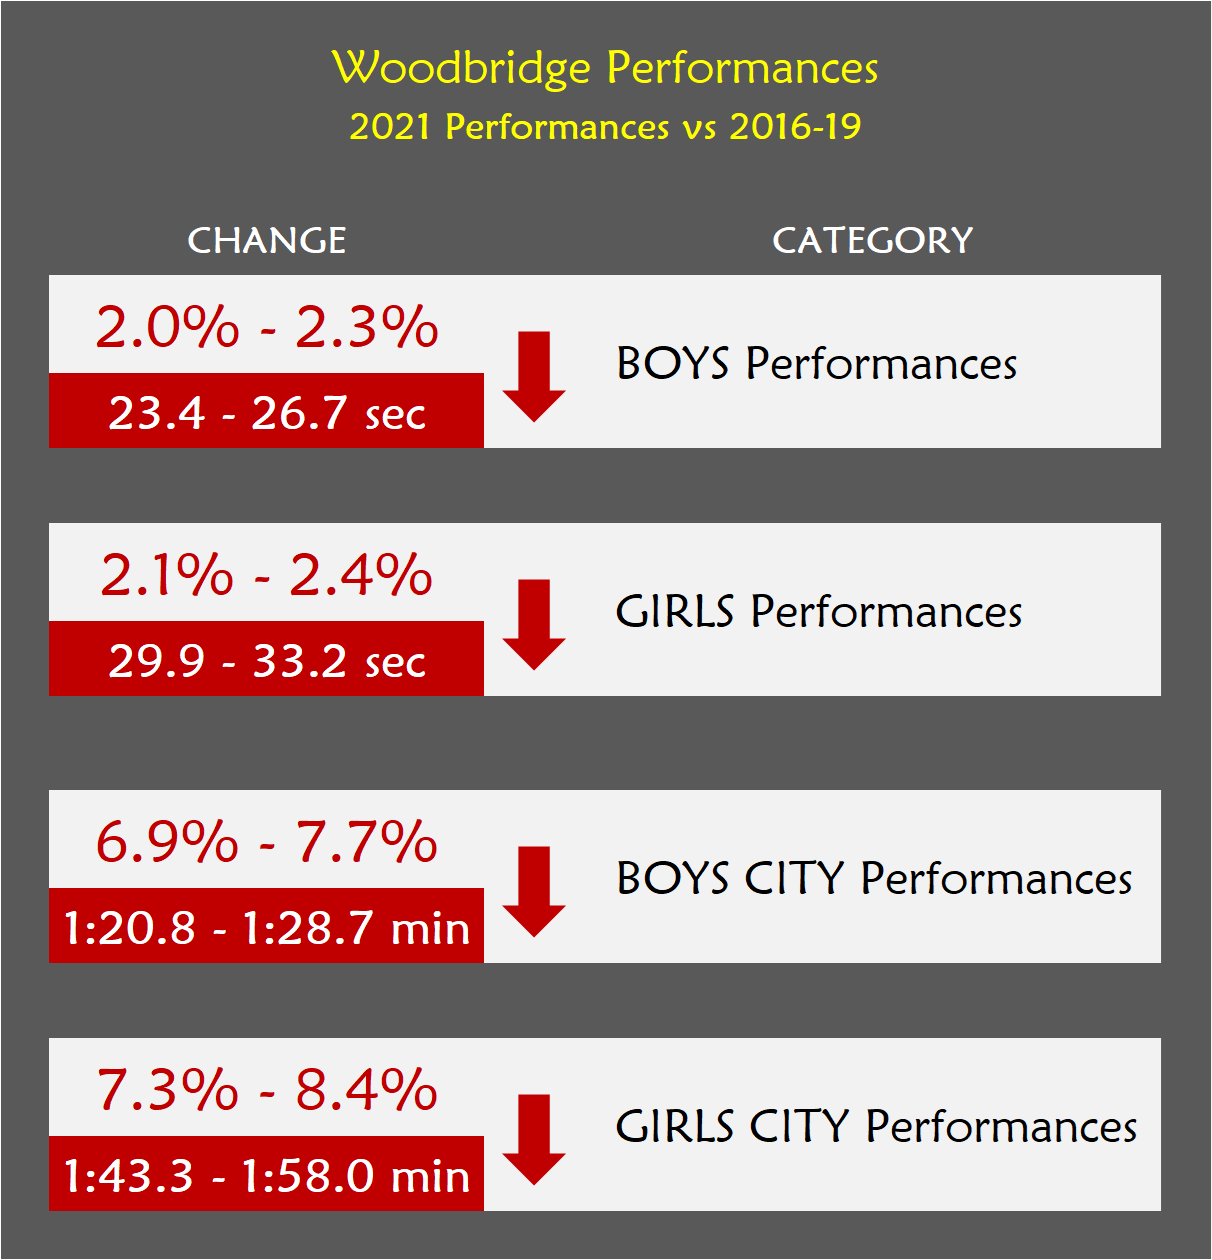
A one-percent (1.0 %) change in Woodbridge performances in 2021 is equivalent to approximately 14 seconds for girls and 12 seconds for boys.
Across the board performances were down with CITY runners particularly hard hit - average CITY finish times were slower by over a minute in 2021 versus 2016-2019.
The Woodbridge Data
The graph below depicts the complete dataset we used to evaluate the impact of COVID on race performances in 2021. The graph plots all 53,779 performances for all runners who competed and finished any race at the Woodbridge XC Invitationals from 2016 thru 2021.

For more details about this data and why we chose the Woodbridge Invitational for our analysis CLICK HERE.
To look at CITY-specific analysis CLICK HERE.
And for the statistics nerds read on! We slice-and-dice this data to look at grade-specific AND percentile-ranked performance change, for all runners as well as City runners
Woodbridge Summary
2021 vs 2019 and 2016 - ’19
The charts below summarize ‘School Participation’ and ‘Athlete Performance’ for the 3 periods we analyzed: 2021, 2019 and 2016-2019.
Percentages reflect changes compared to 2021.

School participation was slightly down versus 2019 but athlete participation, both in total and per school, were down significantly; as much as 25.5%.
Note: One percentage point equals approximately 12 seconds for boys and 14 seconds for girls.

The numbers framed in RED are the same numbers presented on the 1st page.
Summary by Grade
The charts below further break-out the data to present average performances by grade for each of the 3 periods - 20121, 2019, and 2016-19.

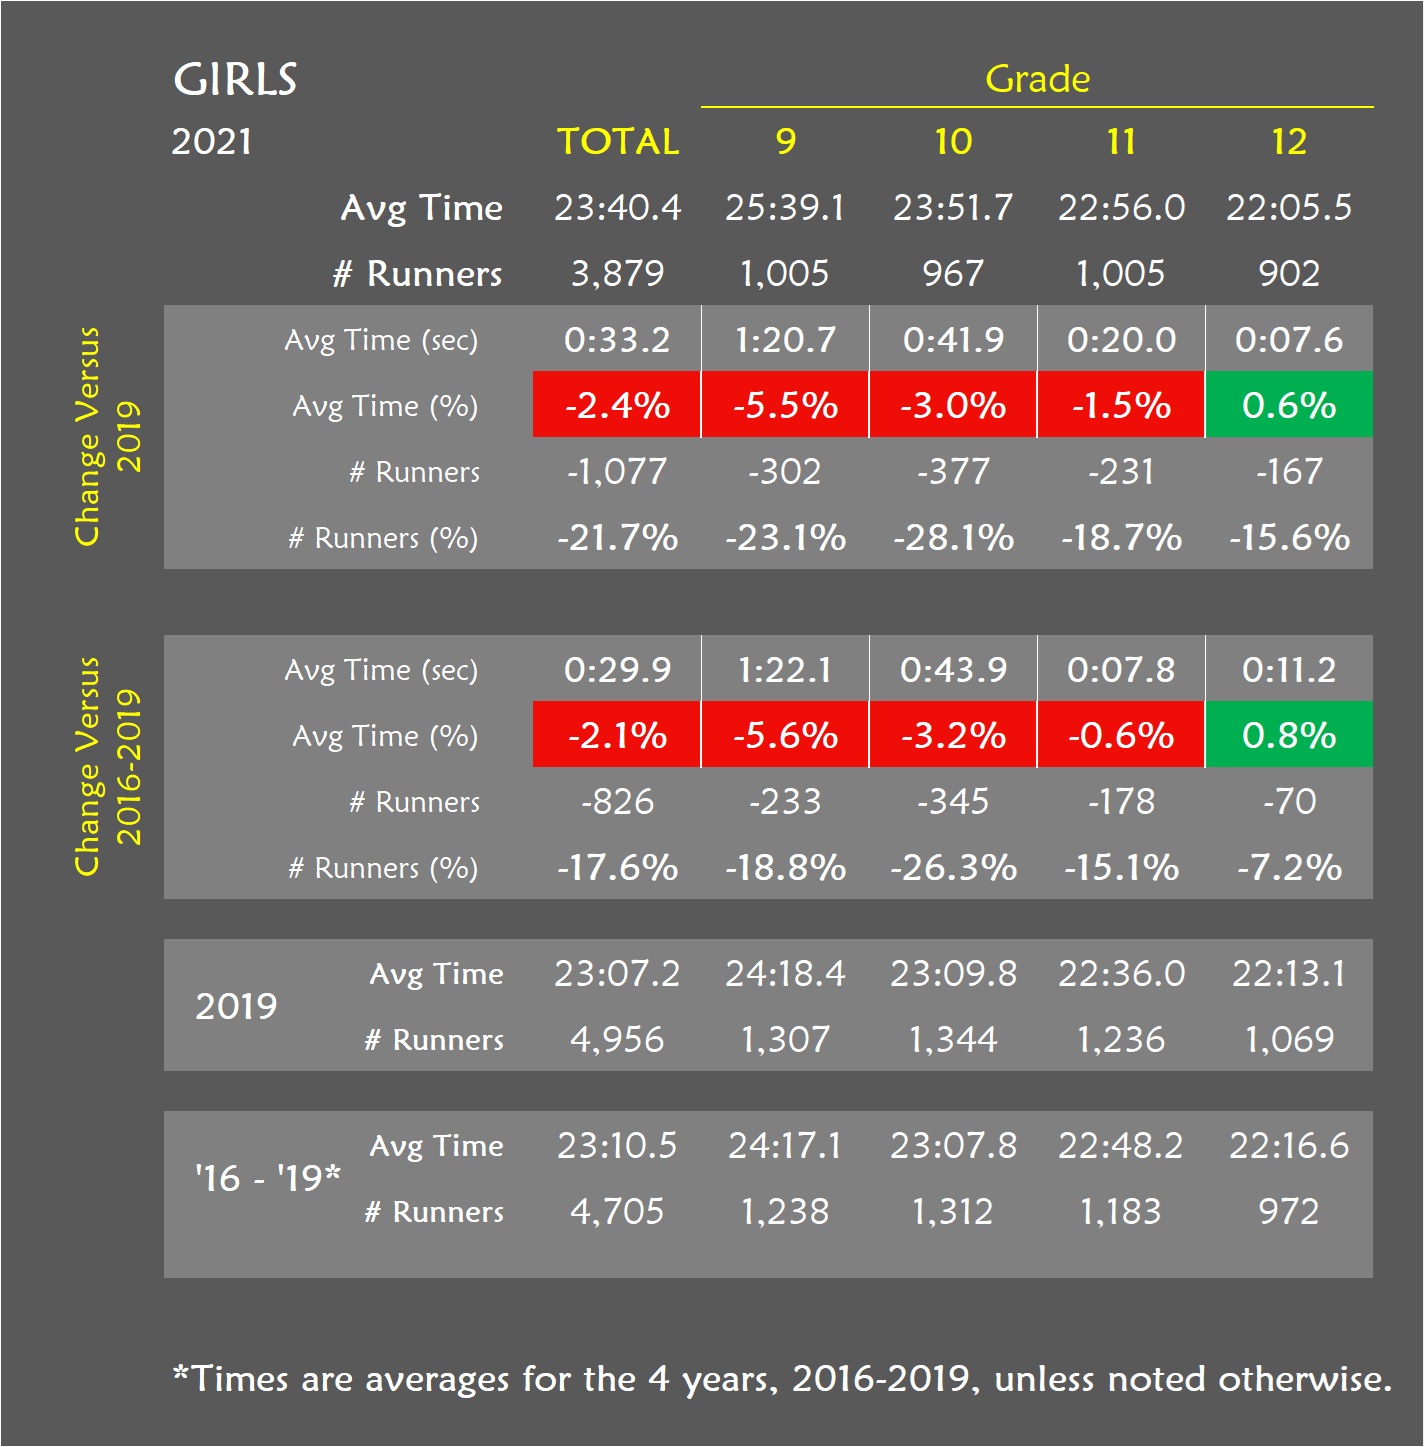
Some of our findings from the grade-specific anaysis:
All classes, boys and girls, underperformed in 2021 versus 2016-2019 EXCEPT senior girls who outperformed both their 2019 and 2016-19 counterparts.
Freshman and Sophomore classes were particularly heard hit with performances off as much as 5.6%.
Summary by Percentile
The tables below further segment data by percentiles to highlight subtle impacts that might be lurking in the details. Percentile segments are defined in 10% increments calculated on total runner counts for each category for each of the timeframes (e.g. - 2021, 2019, 2016-2019).
Click here to see the source data used to calculate the net change percentages in these tables.

Green figures indicate improved performances in ‘21 versus prior years.
Some observations on the BOYS percentiles:
Freshman and senior boys in the top 10% in 2021 outperformed their counterparts in previous years.
Runners in the lowest 30% saw the biggest declines in performance in 2021.
Senior girls in ‘21 outperformed other years except in the lower percentiles.
Click on any table to see the City-specific tables.

The GIRLS percentiles were more provocative:
Senior girls in ‘21 outperformed their counterparts from previous years in every percentile segment except the lowest 10%.
Top 10% performers in 10th - 12th outperformend prior years
Sophmore girls in the top 10% and seniors in the 90th % had the best performances relative to prior years.
Freshman girls in the 80th % had the worst performance relative to prior years.